 It pays to pay with Onestpay

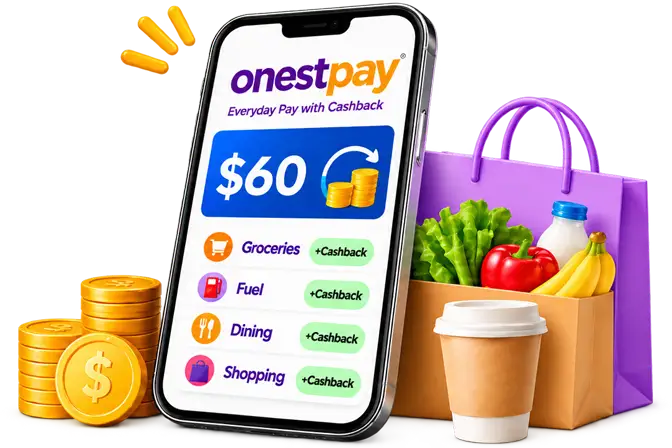
Spend Your Way to Wealth
Building wealth can feel like you have to find extra money in your budget every month. Cashback gives you a place to start with purchases you already planned. When you earn cashback on eligible purchases, you can put those rewards toward a loan balance, set them aside for a down payment, or invest them for the long term.
$0 Extra Required From You
In this guide, the entire extra payment or contribution comes from earned cashback. You still pay for your everyday purchases and make your regular loan payments. If you earn $60 in cashback and put it toward a goal, the additional $60 comes from your rewards, with $0 in additional contributions from your budget.
Power of Cashback
Cashback can help build wealth when you earn it on purchases you already planned and put it to work month after month. At an illustrative 5% average cashback rate, $1,200 in eligible monthly spending earns $60 a month, or $720 a year.
- Pay off debt sooner. Add cashback to your regular payment to reduce principal faster and pay less interest over the life of the loan.
- Build a nest egg. Set cashback aside for retirement, college, or a home down payment. Over 20 years, $60 a month adds up to $14,400 in contributions. If invested at an assumed 7.5% annual return, it could grow to about $32,237 before taxes and fees.
- Keep saving after a debt is paid off. Once a loan is gone, you can redirect the monthly payment you’ve freed up, along with future cashback, toward your next goal.
Each row below shows what the full $60 could do for one goal. Investment returns are illustrative and can vary.
| Opportunities | Illustrative result using $60 per month | Explanation |
|---|---|---|
| Earn cashback on everyday purchases | $60/month estimated cashback, or $720/year. | You spend $1,200 per month on eligible purchases and earn an average of 5% cashback. |
| Pay off your mortgage sooner | 24 months sooner and $24,179 less interest. | You owe $250,000 at 6.5% and have 25 years left on your mortgage. You pay about $1,688 a month in principal and interest and put another $60 toward principal. |
| Pay off your car loan sooner | 7 months sooner and $565 less interest. | You owe $25,000 at 6.5% with five years left. You add $60 to your regular payment of about $489 a month. |
| Pay down student loans | 20 months sooner and $1,943 less interest. | You owe $35,000 at 5.5% with 10 years left. You add $60 to your regular payment of about $380 a month. |
| Get out of credit card debt sooner | 11 months sooner and $878 less interest. | You owe $8,000 at 18.99% APR and raise your fixed monthly payment from $250 to $310. The rate stays the same and you make no new purchases. |
| Build a retirement nest egg | $65,271 projected at 7.5%, including $20,160 contributed. | You start at age 40 with $0, invest $60 a month until age 68, and assume a 7.5% annual return. |
| Save for college | $32,237 projected at 7.5%, including $14,400 contributed. | You have 20 years until college, start at $0, and invest $60 a month at an assumed 7.5% annual return. |
| Grow your investments | $32,237 projected at 7.5%, including $14,400 contributed. | You start at $0 and invest $60 at the end of each month for 20 years at an assumed 7.5% annual return. |
| Build a home down payment | $32,237 projected at 7.5%, including $14,400 contributed. At a 20% down payment, $32,237 corresponds to about $161,186 in additional purchase price supported by the down payment alone. | You start at $0 and invest $60 a month for 20 years at an assumed 7.5% annual return. The purchase-price example assumes you put 20% down. |
Start with purchases you already planned. If you split the cashback between goals, enter only the amount each goal receives. For example, use $40 for credit card payoff and $20 for retirement.
Cashback Calculator
Estimate cashback on everyday purchases you plan to make through OnestPay.
Worked example
In this example, $450 in groceries earns $22.50 and $300 in dining earns $15. Gas, household purchases, and entertainment bring the monthly total to $60.
What to enter. Enter monthly spending in Simple mode, or break it down by category in Advanced mode. Include only purchases you expect to make at participating brands.
How to read the charts. The category bars show where your estimate comes from. The rate bars show how sensitive that estimate is to the average cashback rate.

Groceries provide the largest share of the $60 because they account for the most spending in this example.

On the same $1,200 in spending, a 2% average earns $24, a 3.5% average earns $42, and a 5% average earns $60.
Mortgage Payoff
Mortgage payoff means paying the remaining loan balance down to zero.
Worked example
Start with $250,000 at 6.5% and 25 years remaining. Your regular principal and interest payment is about $1,688.02. Applying $60 more to principal each month brings that to $1,748.02. As principal falls faster, less interest accrues over the remaining life of the loan.
What to enter. Enter your remaining mortgage balance, interest rate, remaining term or payoff date, and monthly principal and interest payment. Leave out escrow for taxes and insurance.
How to read the charts. Use the line endpoints to compare payoff dates. The gap between the interest bars is the estimated interest saved.

Both lines start at $250,000. The line with cashback reaches zero at month 276. The regular schedule reaches zero at month 300.

The bars show all the interest paid over each schedule. The gap is about $24,179.
Car Loan Payoff
See how much sooner you could clear your car loan and how much interest you could save.
Worked example
On a $25,000 loan at 6.5% with five years remaining, add $60 to the regular $489.15 payment. Paying about $549.15 per month reduces the balance faster.
What to enter. Enter your current auto loan balance, interest rate, remaining term or payoff date, and monthly payment.
How to read the charts. The second line shows how the balance falls when you apply $60 each month in addition to your regular payment.

The regular payment runs for 60 months. The extra $60 brings the balance to zero in about 53 months.

The shorter bar shows total interest with the extra payment. The difference is about $565.
Student Loan Payoff
Student loan payoff measures the time and interest needed to clear a loan.
Worked example
On a $35,000 balance at 5.5%, adding $60 to the regular $379.84 payment brings your monthly payment to about $439.84. If you have several loans, model the balance you plan to target.
What to enter. Enter your current student loan balance, interest rate, remaining term or payoff date, and regular payment. For loans with different rates, model the loan you want to pay down.
How to read the charts. Compare the payoff dates and total interest for that loan under both payment schedules.

The regular schedule takes 120 months. Adding cashback brings the loan balance to zero in about 100 months.

Compare the total interest under both schedules. The extra payment saves about $1,943.
Credit Card Payoff
See how long it could take to clear a credit card balance and what you could save in interest.
Worked example
For $8,000 at 18.99% APR, compare paying $250 each month with paying $310. The example assumes a fixed APR and no new purchases.
What to enter. Enter the current balance, APR, and a fixed monthly payment. Add the cashback you plan to put toward the balance.
How to read the charts. In the example, paying $310 instead of $250 each month reduces the payoff period from 45 to 34 months.

Look where each line hits zero. That happens at month 45 with regular payments and month 34 with the extra $60.

Total interest falls from about $3,242 to $2,364 in the example.
Retirement Savings
See how monthly cashback could help build your retirement nest egg.
Worked example
Starting at age 40 gives you 28 years to invest $60 a month. At the assumed 7.5% return, the projected balance includes about $45,111 of growth.
What to enter. Enter your current age, planned retirement age, and assumed annual return.
How to read the charts. The two lines show how much you contribute and how much the projected balance could grow over the years until retirement.

The contributions line rises by the same amount each year. The projected balance curves upward as assumed returns accumulate.

Each bar uses the same $60 monthly contribution and 28-year timeline. Only the assumed return changes.
College Savings
Estimate how much cashback could contribute to college costs by the time school starts.
Worked example
In 20 years, you’d contribute $14,400 from cashback. At a hypothetical 7.5% annual return, growth adds about $17,837.
What to enter. Enter the years until college and choose an assumed annual return.
How to read the charts. Read the ending balance as the projected amount available at the start of college.

The gap between the lines at year 20 shows how much of the projected college fund comes from growth.

The bars compare the projected amount available at the start of college under three return assumptions.
Investment Growth
See how regular cashback contributions could grow over time.
Worked example
Start at $0 and invest $60 at the end of each month for 20 years. At an assumed 7.5% annual return, gains can generate further gains over time.
What to enter. Choose your investment horizon and an assumed annual return.
How to read the charts. Compare the balance at each return assumption to see how much of the result depends on growth.
Compare the steady rise in your contributions with the faster rise in the projected balance later in the example.
The bars show how different returns change the ending balance even though you contribute the same amount.
Home Down Payment
Estimate how much cashback could add to a future home down payment.
Worked example
If $60 per month grows to $32,237 over 20 years, dividing that balance by 20% gives the corresponding purchase-price amount. How much you can afford also depends on financing, income, closing costs, and other expenses.
What to enter. Enter the years until you plan to buy, an assumed annual return, and any additional monthly contribution you want to model.
How to read the charts. Use the projected balance to estimate the added down payment. The purchase price figure reflects what that down payment alone could support.
The lines compare the amount you set aside with the projected amount available for a down payment.
The bars show how the projected down payment changes under different return assumptions.
Conclusion
Cashback builds wealth gradually. If you already spend within your budget, you can give the rewards from those purchases a purpose. Putting cashback toward debt can help you pay less interest and finish repayment sooner. Setting it aside can help build a nest egg for retirement, college, or a home.
At $60 a month, you’d set aside $720 in a year. That may feel modest at first, but each month’s rewards can move you closer to a goal without increasing what you spend or asking you to contribute extra money from your budget.
Illustration assumptions
Payoff scenarios use fixed monthly payments and interest calculated monthly at APR divided by 12. They exclude new charges, fees, and penalties. The home purchase price illustration uses a 20% down payment and considers only the down payment, while affordability also depends on loan payments, income, and other costs.
Growth scenarios start at $0 and convert each assumed annual return to an equivalent monthly rate. They exclude taxes and fees. Actual investment returns fluctuate and can be negative.